Matplotlib 使用
约 1027 个字 764 行代码 4 张图片 预计阅读时间 13 分钟
介绍
Python 绘图包
参考资料
- 官方 cheatsheet
- Matplotlib Tutorial:GitHub - rougier/matplotlib-tutorial: Matplotlib tutorial for beginner
- 精美科研绘图示例:Veusz 2D Examples
-
在 Matplolib 中使用 LaTeX:Use latex with matplotlib on HPCs where you can't sudo! · GitHub
-
mpltex 用于绘制论文级别的图
-
Seaborn Style 使用:Seaborn Styling, Part 1: Figure Style and Scale - Codecademy
from matplotlib.axes import Axes

fig = plt.figure()
ax = fig.subplots()

ax: Axes    # ax 类型提示;VSCode 中 Matplotlib 高版本默认不显示其高亮

# 查看下两者区别
ax = plt.subplot()

fig, ax = plt.subplots()

ax = fig.add_subplot()  # 返回 Axes object
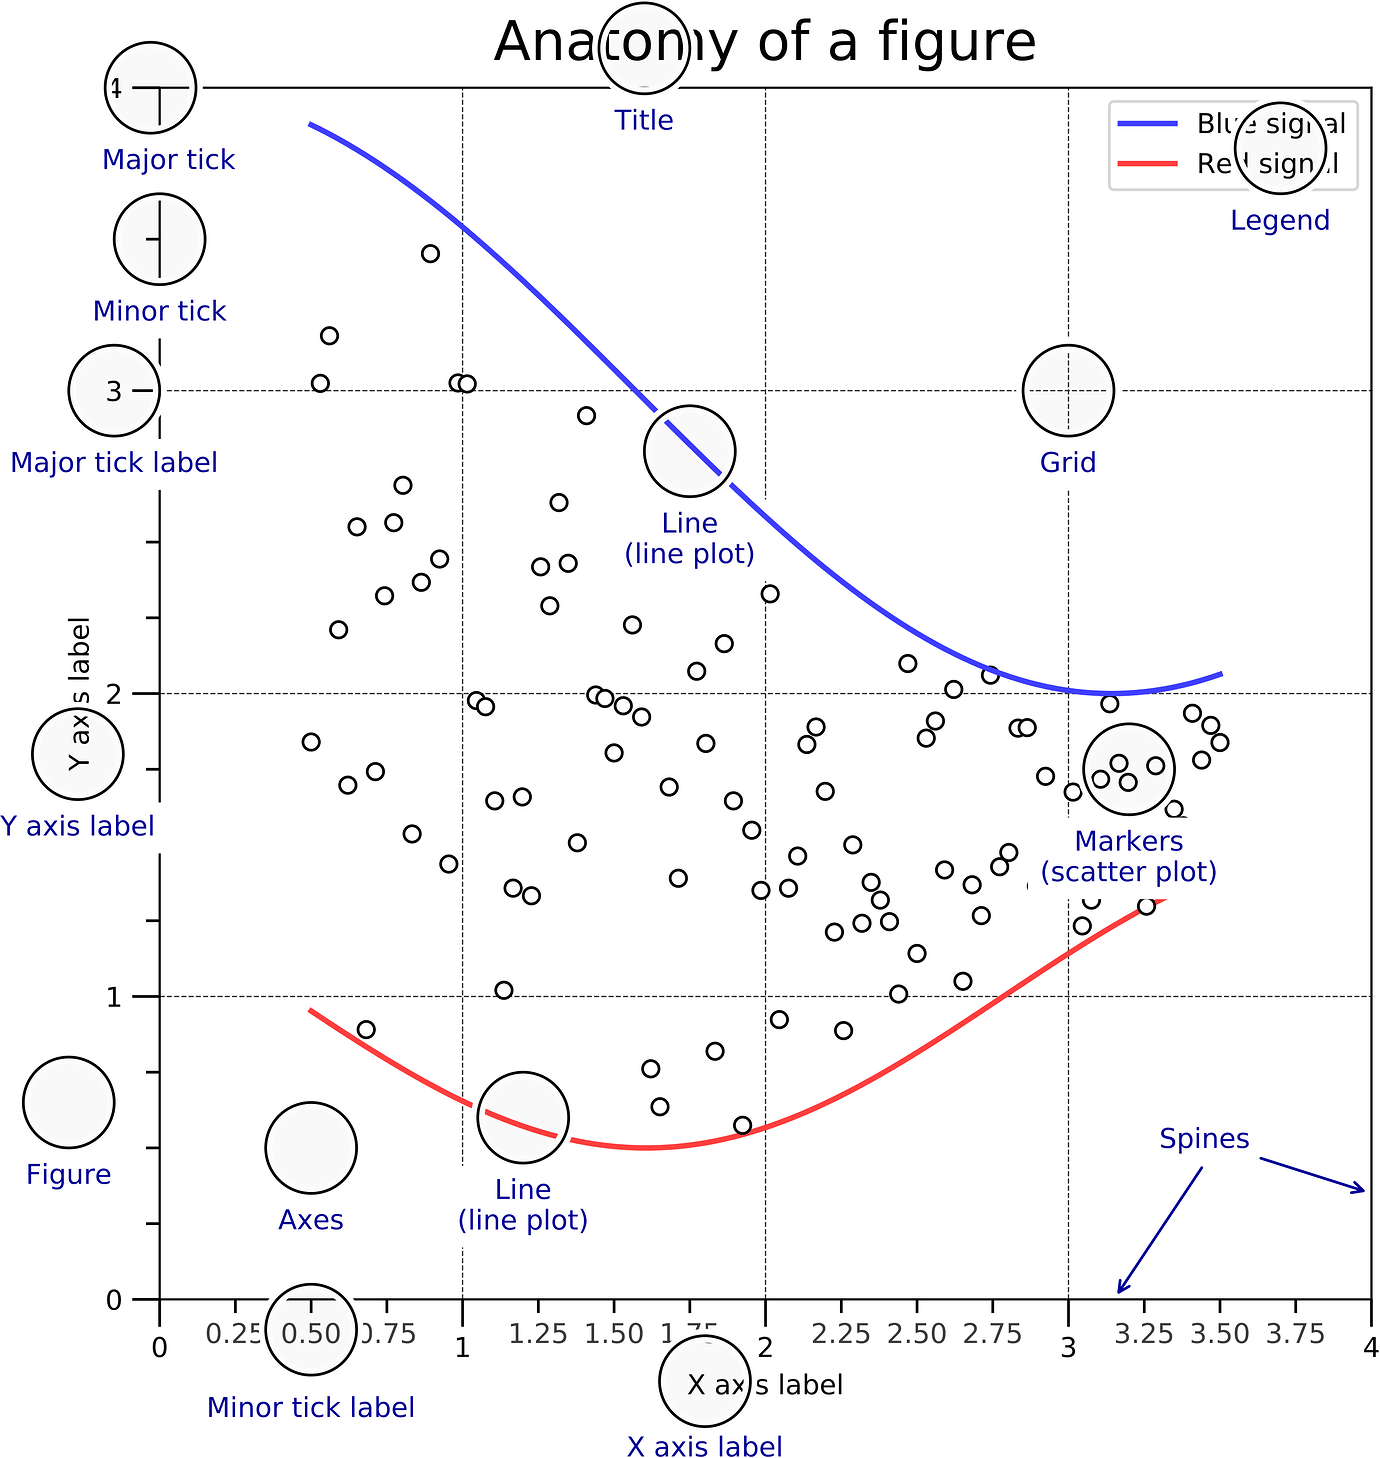
Matplotlib 图中的所有元素
# 新字体使用时,rebuild font cache list,防止没有检测到
import matplotlib.font_manager

matplotlib.font_manager._rebuild()
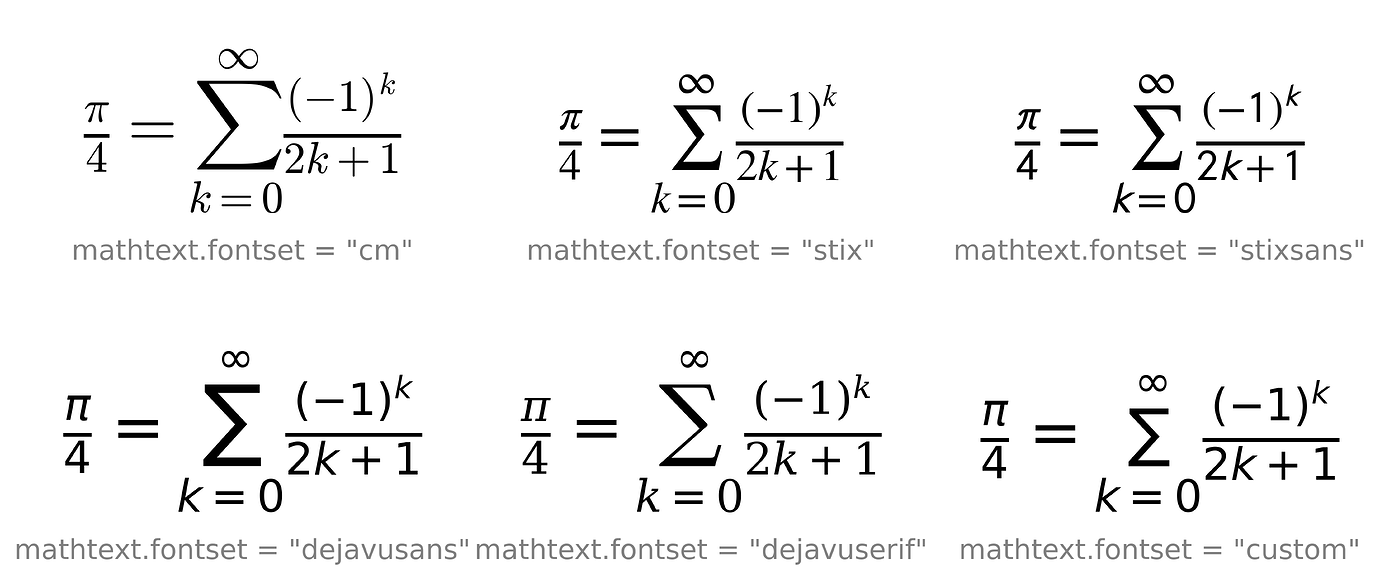
数学字体(默认为 dejavusans):Writing mathematical expressions — Matplotlib 3.8.4 documentation
# 自定义刻度标签 {x} 表示当前刻度值
# 方式 1
ax.yaxis.set_major_formatter("{x:.2f}")

# 方式 2
from matplotlib.ticker import StrMethodFormatter

ax.yaxis.set_major_formatter(StrMethodFormatter("{x:.1f}"))
使用
基本
- 函数式绘图(隐式):调用
matplotlib.pyplot中的函数来创建图形,如plot()等;绘制子图较麻烦
import matplotlib.pyplot as plt
import numpy as np

x = np.linspace(0, 2 * np.pi, 100)
y = np.sin(x)

plt.plot(x, y, label="$y=\sin(x)$")

plt.xlabel("x")
plt.ylabel("y")
plt.legend()

plt.show()

# plt.savefig("sin.png")
- 对象式绘图(显式):通过显式创建 Figure 和 Axes 对象来创建绘图区域,然后在其上调用相应的方法绘制各种图形元素;绘制子图方便
import matplotlib.pyplot as plt
import numpy as np

x = np.linspace(0, 2 * np.pi, 100)
y = np.sin(x)

fig, ax = plt.subplots()

ax.plot(x, y, label="$y=\sin(x)$")

ax.set_xlabel("x")
ax.set_ylabel("y")
ax.legend()

plt.show()

# fig.savefig("sin.png")
轴属性
ax.set():设置轴属性,可接受多种参数;matplotlib.axes.Axes.set
ax.set()

# 参数
title                          # 图标题
xlim / ylim                    # x、y 轴范围
xlabel / ylabel                # x、y 轴标签
xticks / yticks                # x、y 轴刻度
xticklabels / yticklabels      # x、y 轴刻度标签
xscale / yscale                # x、y 轴比例
facecolor                      # 轴背景颜色


# 写法一
ax.set_xlabel("x")
ax.set_ylabel("y")
# 写法二
ax.set(
    xlabel="x",
    ylabel="y",
)
图例
-
图例符号称为 handle
-
将两个图例 label 放在一行的示例:Legend Demo — Matplotlib 3.9.2 documentation
ax.legend(ncols, loc, bbox_to_anchor, ...)

# 参数
ncols               # 图例排布列数
loc                 # 图例位置
columnspacing       # 图例之间的列间距;个人设置为 0.5
labelspacing        # 图例之间的行间距;个人设置为 0.3
handletextpad       # 图例符号与文本间的间距;个人设置为 0.2
handlelength        # 图例符号长度
frameon             # 是否开启图例边框
framealpha          # 图例边框背景透明度
bbox_to_anchor      # 2-tuple floats,(x, y);x≥1.0 时,图例在外面


ax.plot(x, y, label="_nolegend_")      # label 不在图例上显示
ax.legend([])                          # 不显示图例
ax.get_legend().remove()               # 移除当前图例

# 获取图例句柄和标签
handles, labels = ax.get_legend_handles_labels()
- 修改图例顺序
# reference: https://eastsheng.github.io/MyWiki/wiki/2024/06/22/codes/python/python_skills_3
handles, labels = ax.get_legend_handles_labels()

legend_order_list = [2, 0, 1]
ax.legend(
    [handles[idx] for idx in legend_order_list],
    [labels[idx] for idx in legend_order_list],
)
- 图例拆分成多组
# reference: https://eastsheng.github.io/MyWiki/wiki/2024/06/22/codes/python/python_skills_3
# 添加第一个图例
first_legend = ax.legend(
    handles=ax.get_lines()[:3],
    loc="upper left",
)
ax.add_artist(first_legend)
first_legend.get_frame().set_alpha(0)   # 使第一个图例背景透明

# 添加第二个图例
second_legend = ax.legend(
    handles=ax.get_lines()[3:],
    loc="upper right",
)
ax.add_artist(second_legend)
- matplotlib 中的 legend 填充是行优先填充,无列优先填充的参数值实现:[ENH]: matplotlib legend fill columnswise · Issue #27067 · matplotlib/matplotlib
字体
-
Times New Roman 字体问题:Linux 默认没有该字体,可将该字体拷贝到
~/.fonts或~/.local/share/fonts -
临时使用中文字体:Matplotlib学习笔记.md
import matplotlib
import matplotlib.pyplot as plt
from matplotlib.font_manager import FontProperties

zh_font = FontProperties(fname="./SimHei.ttf")

plt.xlabel("x 轴", fontproperties = zh_font)
plt.ylabel("y 轴", fontproperties = zh_font)

plt.legend(props={"family": "SimHei"})
配色
- SciencePlots/scienceplots/styles/color at master · garrettj403/SciencePlots · GitHub
-
scripts/scripts/python/color.py at master · yh-phys/scripts · GitHub
- 审稿人也会爱的配色~科研配色收藏第9期 - 知乎
import matplotlib.pyplot as plt

plt.rcParams["axes.prop_cycle"].by_key()["color"]

# 默认颜色循环
prop_cycle_list = [
    "#1f77b4",
    "#ff7f0e",
    "#2ca02c",
    "#d62728",
    "#9467bd",
    "#8c564b",
    "#e377c2",
    "#7f7f7f",
    "#bcbd22",
    "#17becf",
]


"#4F4FFE"
"#CE3D32"
配置文件路径
import matplotlib

# matplotlib 库的配置文件路径
# matplotlib/mpl-data/matplotlibrc
matplotlib.matplotlib_fname()

# matplotlib/mpl-data/
# 字体所在路径 matplotlib/mpl-data/fonts/ttf
matplotlib.get_data_path()

# matplotlib 缓存路径 ~/.cache/matplotlib
matplotlib.get_cachedir()
rcParams
# 方式 1
import matplotlib.pyplot as plt

plt.rcParams.keys()

# 方式 2
import matplotlib

matplotlib.rc_params()
- rcParams 所有参数
KeysView(RcParams({'_internal.classic_mode': False,
          'agg.path.chunksize': 0,
          'animation.bitrate': -1,
          'animation.codec': 'h264',
          'animation.convert_args': ['-layers', 'OptimizePlus'],
          'animation.convert_path': 'convert',
          'animation.embed_limit': 20.0,
          'animation.ffmpeg_args': [],
          'animation.ffmpeg_path': 'ffmpeg',
          'animation.frame_format': 'png',
          'animation.html': 'none',
          'animation.writer': 'ffmpeg',
          'axes.autolimit_mode': 'data',
          'axes.axisbelow': 'line',
          'axes.edgecolor': 'black',
          'axes.facecolor': 'white',
          'axes.formatter.limits': [-5, 6],
          'axes.formatter.min_exponent': 0,
          'axes.formatter.offset_threshold': 4,
          'axes.formatter.use_locale': False,
          'axes.formatter.use_mathtext': False,
          'axes.formatter.useoffset': True,
          'axes.grid': False,
          'axes.grid.axis': 'both',
          'axes.grid.which': 'major',
          'axes.labelcolor': 'black',
          'axes.labelpad': 4.0,
          'axes.labelsize': 'medium',
          'axes.labelweight': 'normal',
          'axes.linewidth': 0.8,
          'axes.prop_cycle': cycler('color', ['#1f77b4', '#ff7f0e', '#2ca02c', '#d62728', '#9467bd', '#8c564b', '#e377c2', '#7f7f7f', '#bcbd22', '#17becf']),
          'axes.spines.bottom': True,
          'axes.spines.left': True,
          'axes.spines.right': True,
          'axes.spines.top': True,
          'axes.titlecolor': 'auto',
          'axes.titlelocation': 'center',
          'axes.titlepad': 6.0,
          'axes.titlesize': 'large',
          'axes.titleweight': 'normal',
          'axes.titley': None,
          'axes.unicode_minus': True,
          'axes.xmargin': 0.05,
          'axes.ymargin': 0.05,
          'axes.zmargin': 0.05,
          'axes3d.grid': True,
          'axes3d.xaxis.panecolor': (0.95, 0.95, 0.95, 0.5),
          'axes3d.yaxis.panecolor': (0.9, 0.9, 0.9, 0.5),
          'axes3d.zaxis.panecolor': (0.925, 0.925, 0.925, 0.5),
          'backend': 'agg',
          'backend_fallback': True,
          'boxplot.bootstrap': None,
          'boxplot.boxprops.color': 'black',
          'boxplot.boxprops.linestyle': '-',
          'boxplot.boxprops.linewidth': 1.0,
          'boxplot.capprops.color': 'black',
          'boxplot.capprops.linestyle': '-',
          'boxplot.capprops.linewidth': 1.0,
          'boxplot.flierprops.color': 'black',
          'boxplot.flierprops.linestyle': 'none',
          'boxplot.flierprops.linewidth': 1.0,
          'boxplot.flierprops.marker': 'o',
          'boxplot.flierprops.markeredgecolor': 'black',
          'boxplot.flierprops.markeredgewidth': 1.0,
          'boxplot.flierprops.markerfacecolor': 'none',
          'boxplot.flierprops.markersize': 6.0,
          'boxplot.meanline': False,
          'boxplot.meanprops.color': 'C2',
          'boxplot.meanprops.linestyle': '--',
          'boxplot.meanprops.linewidth': 1.0,
          'boxplot.meanprops.marker': '^',
          'boxplot.meanprops.markeredgecolor': 'C2',
          'boxplot.meanprops.markerfacecolor': 'C2',
          'boxplot.meanprops.markersize': 6.0,
          'boxplot.medianprops.color': 'C1',
          'boxplot.medianprops.linestyle': '-',
          'boxplot.medianprops.linewidth': 1.0,
          'boxplot.notch': False,
          'boxplot.patchartist': False,
          'boxplot.showbox': True,
          'boxplot.showcaps': True,
          'boxplot.showfliers': True,
          'boxplot.showmeans': False,
          'boxplot.vertical': True,
          'boxplot.whiskerprops.color': 'black',
          'boxplot.whiskerprops.linestyle': '-',
          'boxplot.whiskerprops.linewidth': 1.0,
          'boxplot.whiskers': 1.5,
          'contour.algorithm': 'mpl2014',
          'contour.corner_mask': True,
          'contour.linewidth': None,
          'contour.negative_linestyle': 'dashed',
          'date.autoformatter.day': '%Y-%m-%d',
          'date.autoformatter.hour': '%m-%d %H',
          'date.autoformatter.microsecond': '%M:%S.%f',
          'date.autoformatter.minute': '%d %H:%M',
          'date.autoformatter.month': '%Y-%m',
          'date.autoformatter.second': '%H:%M:%S',
          'date.autoformatter.year': '%Y',
          'date.converter': 'auto',
          'date.epoch': '1970-01-01T00:00:00',
          'date.interval_multiples': True,
          'docstring.hardcopy': False,
          'errorbar.capsize': 0.0,
          'figure.autolayout': False,
          'figure.constrained_layout.h_pad': 0.04167,
          'figure.constrained_layout.hspace': 0.02,
          'figure.constrained_layout.use': False,
          'figure.constrained_layout.w_pad': 0.04167,
          'figure.constrained_layout.wspace': 0.02,
          'figure.dpi': 100.0,
          'figure.edgecolor': 'white',
          'figure.facecolor': 'white',
          'figure.figsize': [6.4, 4.8],
          'figure.frameon': True,
          'figure.hooks': [],
          'figure.labelsize': 'large',
          'figure.labelweight': 'normal',
          'figure.max_open_warning': 20,
          'figure.raise_window': True,
          'figure.subplot.bottom': 0.11,
          'figure.subplot.hspace': 0.2,
          'figure.subplot.left': 0.125,
          'figure.subplot.right': 0.9,
          'figure.subplot.top': 0.88,
          'figure.subplot.wspace': 0.2,
          'figure.titlesize': 'large',
          'figure.titleweight': 'normal',
          'font.cursive': ['Apple Chancery',
                           'Textile',
                           'Zapf Chancery',
                           'Sand',
                           'Script MT',
                           'Felipa',
                           'Comic Neue',
                           'Comic Sans MS',
                           'cursive'],
          'font.family': ['sans-serif'],
          'font.fantasy': ['Chicago',
                           'Charcoal',
                           'Impact',
                           'Western',
                           'Humor Sans',
                           'xkcd',
                           'fantasy'],
          'font.monospace': ['DejaVu Sans Mono',
                             'Bitstream Vera Sans Mono',
                             'Computer Modern Typewriter',
                             'Andale Mono',
                             'Nimbus Mono L',
                             'Courier New',
                             'Courier',
                             'Fixed',
                             'Terminal',
                             'monospace'],
          'font.sans-serif': ['DejaVu Sans',
                              'Bitstream Vera Sans',
                              'Computer Modern Sans Serif',
                              'Lucida Grande',
                              'Verdana',
                              'Geneva',
                              'Lucid',
                              'Arial',
                              'Helvetica',
                              'Avant Garde',
                              'sans-serif'],
          'font.serif': ['DejaVu Serif',
                         'Bitstream Vera Serif',
                         'Computer Modern Roman',
                         'New Century Schoolbook',
                         'Century Schoolbook L',
                         'Utopia',
                         'ITC Bookman',
                         'Bookman',
                         'Nimbus Roman No9 L',
                         'Times New Roman',
                         'Times',
                         'Palatino',
                         'Charter',
                         'serif'],
          'font.size': 10.0,
          'font.stretch': 'normal',
          'font.style': 'normal',
          'font.variant': 'normal',
          'font.weight': 'normal',
          'grid.alpha': 1.0,
          'grid.color': '#b0b0b0',
          'grid.linestyle': '-',
          'grid.linewidth': 0.8,
          'hatch.color': 'black',
          'hatch.linewidth': 1.0,
          'hist.bins': 10,
          'image.aspect': 'equal',
          'image.cmap': 'viridis',
          'image.composite_image': True,
          'image.interpolation': 'antialiased',
          'image.lut': 256,
          'image.origin': 'upper',
          'image.resample': True,
          'interactive': False,
          'keymap.back': ['left', 'c', 'backspace', 'MouseButton.BACK'],
          'keymap.copy': ['ctrl+c', 'cmd+c'],
          'keymap.forward': ['right', 'v', 'MouseButton.FORWARD'],
          'keymap.fullscreen': ['f', 'ctrl+f'],
          'keymap.grid': ['g'],
          'keymap.grid_minor': ['G'],
          'keymap.help': ['f1'],
          'keymap.home': ['h', 'r', 'home'],
          'keymap.pan': ['p'],
          'keymap.quit': ['ctrl+w', 'cmd+w', 'q'],
          'keymap.quit_all': [],
          'keymap.save': ['s', 'ctrl+s'],
          'keymap.xscale': ['k', 'L'],
          'keymap.yscale': ['l'],
          'keymap.zoom': ['o'],
          'legend.borderaxespad': 0.5,
          'legend.borderpad': 0.4,
          'legend.columnspacing': 2.0,
          'legend.edgecolor': '0.8',
          'legend.facecolor': 'inherit',
          'legend.fancybox': True,
          'legend.fontsize': 'medium',
          'legend.framealpha': 0.8,
          'legend.frameon': True,
          'legend.handleheight': 0.7,
          'legend.handlelength': 2.0,
          'legend.handletextpad': 0.8,
          'legend.labelcolor': 'None',
          'legend.labelspacing': 0.5,
          'legend.loc': 'best',
          'legend.markerscale': 1.0,
          'legend.numpoints': 1,
          'legend.scatterpoints': 1,
          'legend.shadow': False,
          'legend.title_fontsize': None,
          'lines.antialiased': True,
          'lines.color': 'C0',
          'lines.dash_capstyle': <CapStyle.butt: 'butt'>,
          'lines.dash_joinstyle': <JoinStyle.round: 'round'>,
          'lines.dashdot_pattern': [6.4, 1.6, 1.0, 1.6],
          'lines.dashed_pattern': [3.7, 1.6],
          'lines.dotted_pattern': [1.0, 1.65],
          'lines.linestyle': '-',
          'lines.linewidth': 1.5,
          'lines.marker': 'None',
          'lines.markeredgecolor': 'auto',
          'lines.markeredgewidth': 1.0,
          'lines.markerfacecolor': 'auto',
          'lines.markersize': 6.0,
          'lines.scale_dashes': True,
          'lines.solid_capstyle': <CapStyle.projecting: 'projecting'>,
          'lines.solid_joinstyle': <JoinStyle.round: 'round'>,
          'markers.fillstyle': 'full',
          'mathtext.bf': 'sans:bold',
          'mathtext.cal': 'cursive',
          'mathtext.default': 'it',
          'mathtext.fallback': 'cm',
          'mathtext.fontset': 'dejavusans',
          'mathtext.it': 'sans:italic',
          'mathtext.rm': 'sans',
          'mathtext.sf': 'sans',
          'mathtext.tt': 'monospace',
          'patch.antialiased': True,
          'patch.edgecolor': 'black',
          'patch.facecolor': 'C0',
          'patch.force_edgecolor': False,
          'patch.linewidth': 1.0,
          'path.effects': [],
          'path.simplify': True,
          'path.simplify_threshold': 0.111111111111,
          'path.sketch': None,
          'path.snap': True,
          'pcolor.shading': 'auto',
          'pcolormesh.snap': True,
          'pdf.compression': 6,
          'pdf.fonttype': 3,
          'pdf.inheritcolor': False,
          'pdf.use14corefonts': False,
          'pgf.preamble': '',
          'pgf.rcfonts': True,
          'pgf.texsystem': 'xelatex',
          'polaraxes.grid': True,
          'ps.distiller.res': 6000,
          'ps.fonttype': 3,
          'ps.papersize': 'letter',
          'ps.useafm': False,
          'ps.usedistiller': None,
          'savefig.bbox': None,
          'savefig.directory': '~',
          'savefig.dpi': 'figure',
          'savefig.edgecolor': 'auto',
          'savefig.facecolor': 'auto',
          'savefig.format': 'png',
          'savefig.orientation': 'portrait',
          'savefig.pad_inches': 0.1,
          'savefig.transparent': False,
          'scatter.edgecolors': 'face',
          'scatter.marker': 'o',
          'svg.fonttype': 'path',
          'svg.hashsalt': None,
          'svg.image_inline': True,
          'text.antialiased': True,
          'text.color': 'black',
          'text.hinting': 'force_autohint',
          'text.hinting_factor': 8,
          'text.kerning_factor': 0,
          'text.latex.preamble': '',
          'text.parse_math': True,
          'text.usetex': False,
          'timezone': 'UTC',
          'tk.window_focus': False,
          'toolbar': 'toolbar2',
          'webagg.address': '127.0.0.1',
          'webagg.open_in_browser': True,
          'webagg.port': 8988,
          'webagg.port_retries': 50,
          'xaxis.labellocation': 'center',
          'xtick.alignment': 'center',
          'xtick.bottom': True,
          'xtick.color': 'black',
          'xtick.direction': 'out',
          'xtick.labelbottom': True,
          'xtick.labelcolor': 'inherit',
          'xtick.labelsize': 'medium',
          'xtick.labeltop': False,
          'xtick.major.bottom': True,
          'xtick.major.pad': 3.5,
          'xtick.major.size': 3.5,
          'xtick.major.top': True,
          'xtick.major.width': 0.8,
          'xtick.minor.bottom': True,
          'xtick.minor.pad': 3.4,
          'xtick.minor.size': 2.0,
          'xtick.minor.top': True,
          'xtick.minor.visible': False,
          'xtick.minor.width': 0.6,
          'xtick.top': False,
          'yaxis.labellocation': 'center',
          'ytick.alignment': 'center_baseline',
          'ytick.color': 'black',
          'ytick.direction': 'out',
          'ytick.labelcolor': 'inherit',
          'ytick.labelleft': True,
          'ytick.labelright': False,
          'ytick.labelsize': 'medium',
          'ytick.left': True,
          'ytick.major.left': True,
          'ytick.major.pad': 3.5,
          'ytick.major.right': True,
          'ytick.major.size': 3.5,
          'ytick.major.width': 0.8,
          'ytick.minor.left': True,
          'ytick.minor.pad': 3.4,
          'ytick.minor.right': True,
          'ytick.minor.size': 2.0,
          'ytick.minor.visible': False,
          'ytick.minor.width': 0.6,
          'ytick.right': False}))
其他
# x 轴 label 变成字符串
ax.set_xticks()

# 设置 x 轴的次刻度 minor tick
ax.set_xticks(range(0, 10, 1), minor=True)

# f-string 对于在图中添加需要 LaTeX 格式的 text 效果不是很好,改用 str.replace()
ax.text(3.0, 1.5, r"RMSE=cha$\,·\,10^{-5}$ Pa$\,·\,$s".replace("cha", str(score_rmse)))


# 将 Y 轴的刻度及 label 放到右边
ax.yaxis.tick_right()
ax.yaxis.set_label_position("right")

# 设置 x/y 轴主、次刻度间隔
from matplotlib.ticker import MultipleLocator

ax.xaxis.set_major_locator(MultipleLocator(0.2))
ax.xaxis.set_minor_locator(MultipleLocator(0.1))

# 让 figure 呈正方形
ax.set_aspect("equal", adjustable="box")

# 正常显示负号
plt.rcParams["axes.unicode_minus"] = False

ax.texts  # 获取文本
ax.texts[0].set_fontsize()


plt.close()         # 关闭当前 Figure 窗口
plt.cla()           # 清除当前轴
plt.clf()           # 清除当前 Figure

fig.savefig()       # Figure 对象的方法
plt.savefig()       # 更加通用的命令;适用于没有明确的 Figure 对象时
绘图类型
常用绘图类型
-
散点图绘制时,无法直接使每个数据点对应不同的 marker
-
marker 样式:matplotlib.markers — Matplotlib 3.9.3 documentation
# 点线图
ax.plot(x, y, ...)

# 参数
color                 # c;颜色
linestyle             # ls;线的样式
linewidth             # lw;线宽
marker                # marker 样式
markeredgecolor       # mec;marker 边缘颜色
markeredgewidth       # mew;marker 边缘宽度
markerfacecolor       # mfc;
markersize            # ms;marker 尺寸


# 散点图
ax.scatter(x, y, s, c, cmap, ...)

# 参数
marker                # marker 样式
s                     # marker size;float 或 array-like
c                     # marker colors;array-like 或 color list;该参数可结合 colorbar 使用
cmap                  # colormap


# 直方图
ax.hist(x, bins, histtype, edgecolor, ...)

bins                  # 将 x 范围等分成 bins 份
edgecolor             # 边缘颜色


# 水平线
ax.axhline()


# 二维直方图
ax.hist2d()


# 填充
ax.fill_between()
- 较美观的点线图:sci作图 - 计算材料学
子图
- 方式 1
- 方式 2
fig, axs = plt.subplots(nrows=1, ncols=2)

# 调整子图之间的间距
fig.subplots_adjust(hspace=0.0, wspace=0.0)

# axs = axs.flatten()
# axs 数组扁平化,利于 for 循环
for i, ax in enumerate(axs.flat):
    ...

    # 第二列的 y 轴坐标刻度不显示
     if i % 2 == 1:
         ax.yaxis.set_tick_params(labelleft=False)

# 设置整个子图的 x y 轴标签;y x 参数调整标签与坐标轴的距离
fig.supxlabel("x", y=0.05)
fig.supylabel("y", x=0.01)

# 添加整个子图的图例 在图外面
handles, labels = ax.get_legend_handles_labels()
fig.legend(handles, labels, bbox_to_anchor=(1.1, 0.1))
插入内嵌放大图
axin = ax.inset_axes()
# 参数
bound:         # [x0, y0, width, height] 左下角的坐标及宽度高度;数值范围均为 0~1

# 在主图上绘制放大区域的边框
ax.indicate_inset_zoom(axins)
双 Y 轴
ax1.plot(...)

ax2 = ax.twinx()
ax2.plot(...)

# 解决双 Y 轴图列重叠问题
lines, labels = ax1.get_legend_handles_labels()
lines2, labels2 = ax2.get_legend_handles_labels()
ax2.legend(lines + lines2, labels + labels2)
误差棒图
import matplotlib.pyplot as plt

x = [1, 2, 3, 4, 5]
y = [2, 3, 2, 4, 2]
yerr = [[0.5, 1, 0.5, 1, 0.5], [1, 2, 1, 2, 1]]  # 下、上误差;需为正值
yerr = [0.5, 1, 0.5, 1, 0.5]  # 上下误差一样

fig, ax = plt.subplots()

ax.errorbar(x, y, yerr=yerr, fmt="o", linewidth=1, capsize=6)

ax.set(xlabel="X", ylabel="Y", title="Error Bar Example")

plt.show()
colorbar
-
GitHub - 1313e/CMasher: Scientific colormaps for making accessible, informative and 'cmashing' plots
-
colormap:从蓝到红渐变:
coolwarm、jet、bwr
# 将 colorbar 放在图片右侧
scatter_ax = ax.scatter(x, y, c=colors, cmap="bwr")
cbar = fig.colorbar(
    scatter_ax,
    ax=ax,  # 第二个参数名为 ax
)
cbar.set_label("colorbar label")


# 将 colorbar 水平放置并嵌在图中右下角
fig, ax = plt.subplots(figsize=(8, 8))
scatter_ax = ax.scatter(x, y, c=colors, cmap="bwr")
# colorbar 位置;[x, y, width, height] 比例
cbar_ax = ax.inset_axes([0.3, 0.05, 0.5, 0.05])
# colorbar 水平放置
fig.colorbar(
    scatter_ax,
    cax=cbar_ax,  # 第二个参数名为 cax
    orientation="horizontal",
)
- 单独绘制 colorbar
# reference: https://eastsheng.github.io/MyWiki/wiki/2024/06/22/codes/python/python_skills_3
import matplotlib.pyplot as plt
from typing import Literal


def colorbar(orientation=Literal["vertical", "horizontal"]):
    if orientation == "vertical":
        fig, ax = plt.subplots(figsize=(1.5, 6))
        ax_position = [0.45, 0.2, 0.10, 0.6]
    elif orientation == "horizontal":
        fig, ax = plt.subplots(figsize=(6, 1.5))
        ax_position = [0.2, 0.45, 0.6, 0.20]

    ax.set_position(ax_position)  # 设置轴的位置

    cmap = plt.get_cmap("jet")
    norm = plt.Normalize(vmin=0, vmax=1)
    cb = plt.colorbar(
        plt.cm.ScalarMappable(norm=norm, cmap=cmap),
        cax=ax,
        orientation=orientation,
    )

    cb.set_ticks = [0, 0.2, 0.4, 0.6, 0.8, 1.0]


if __name__ == "__main__":
    orientation = "horizontal"
    colorbar(orientation=orientation)
3D
import matplotlib.pyplot as plt
import numpy as np

np.random.seed(42)
num_points = 100
x = np.random.rand(num_points)
y = np.random.rand(num_points)
z = np.random.rand(num_points)

fig, ax = plt.subplots(subplot_kw={"projection": "3d"}, figsize=(10, 8))

ax.scatter(x, y, z, c="b", marker="o", label="3d plot")

ax.set(xlabel="X", ylabel="Y", zlabel="Z")
ax.legend()

plt.show()
箱线图
-
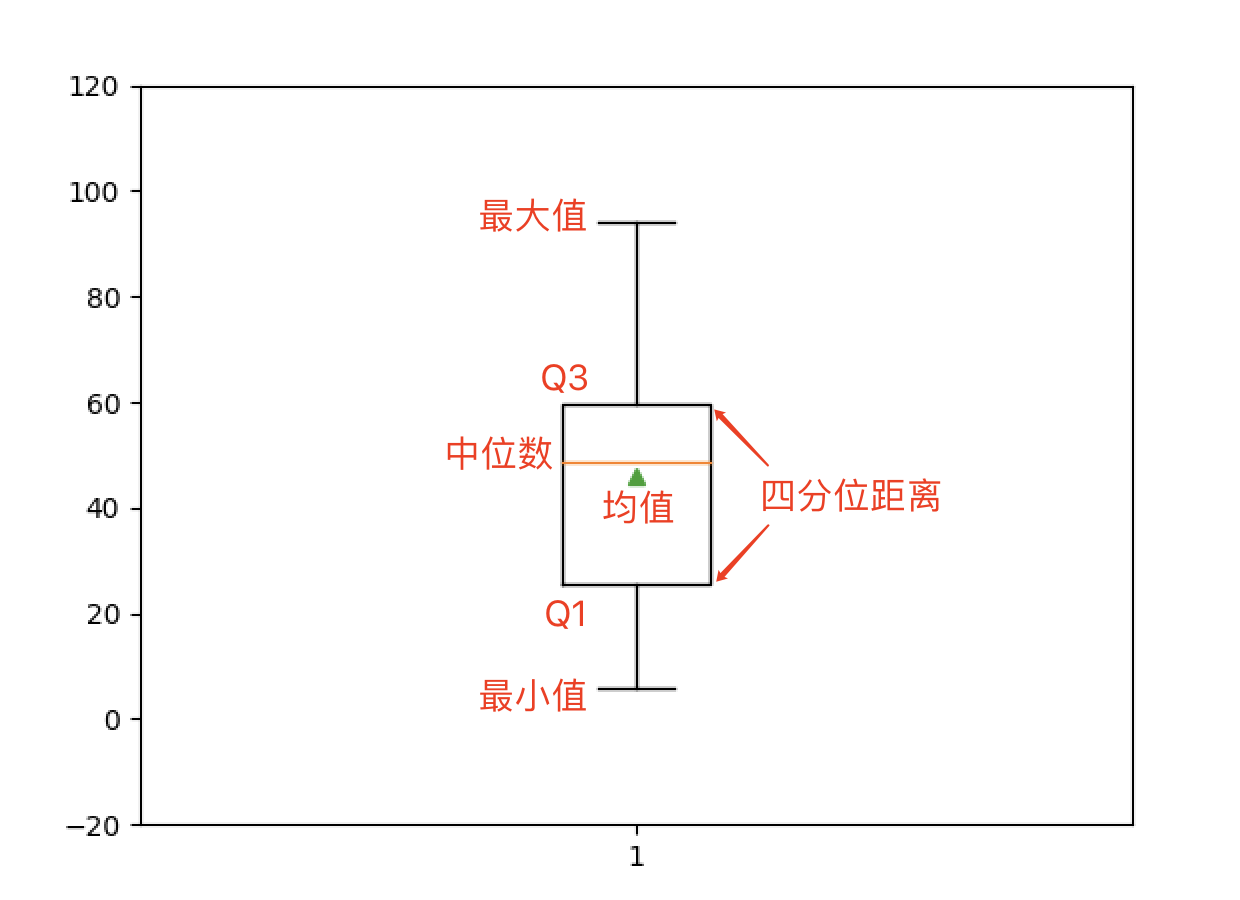
箱线图(boxplot,箱型图、盒须图,用于显示数据分布)的数据组成:最小值、第一四分位数(Q1)、中位数(Median)、第三四分位数(Q3)、最大值
-
图形结构:
- 箱子(Box): 从 Q1 到 Q3,表示中间的 50% 数据(IQR)
- 中位线:箱子中间的一条线,表示中位数
- “胡须”(Whiskers): 通常延伸到 Q1 - 1.5×IQR 和 Q3 + 1.5×IQR 之间的最小值和最大值
- 异常值(Outliers):在 Q1 - 1.5×IQR ~ Q3 + 1.5×IQR 外的数据点
-
Interquartile Range(四分位距,简称 IQR) 是衡量数据离散程度的重要指标之一,用于表示中间 50% 数据的范围
其他绘图类型
-
matplotlib joint 绘制(上、右两侧分别是 x, y 的直方图)
-
热图 heatmap / 关联图绘制:
plt.matshow(),seaborn.heatmap() -
饼状关联图绘制(Origin 可以绘制):biokit/notebooks/viz/corrplot.ipynb at master · biokit/biokit · GitHub
-
手绘风格(无必要):需安装 xkcd-script font(但还是会提示找不到相关字体);XKCD
其他
- 平滑
plot绘制的曲线:python - Plot smooth line with PyPlot - Stack Overflow
from scipy.interpolate import make_interp_spline, BSpline

# 生成更密的数据点
smooth_x = np.linspace(T.min(), T.max(), 300)

spl = make_interp_spline(T, power, k=3)
smooth_y = spl(xnew)

ax.plot(smooth_x, smooth_y)
-
找到一个适合的 color cycle
-
Matplotlib mplstyle 写法:CGCNN_VFE/pre_and_post_processing/npj_custom_format.mplstyle at main · Materials-Computation-Data-Science-MCDC/CGCNN_VFE · GitHub
-
hatch:填充样式
-
双 Y 轴 + brokenaxes 绘制(matplotlib 及 brokenaxes 实现效果一般,建议还是用 Origin):python - Matplotlib with brokenaxes package second Y-Axis - Stack Overflow
-
在 Jupyter Notebook 中使用
%matplotlib inline,从 matplotlib 3.2 版本开始,这个命令在大多数情况下已不再是必需的,因为 Jupyter 和 IPython 的默认行为已经是将图形内嵌显示 -
给每张子图表 (a) (b) 序号标签(最后其实还是用 ax.text() 实现;效果一般):Labelling subplots — Matplotlib 3.8.4 documentation
-
箱线图又称为盒须图,是显示一组数据分散情况的统计图,因形状如箱子而得名。 它主要用于反映原始数据分布的特征,还可以进行多组数据分布特征的比较。


